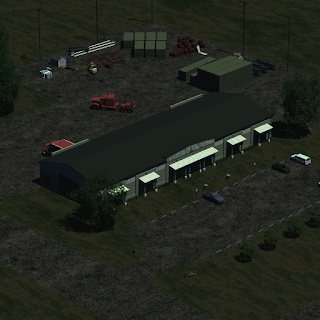
Included in the DIRSIG-4.4.0 release candidate is a new "warehouse" scene.
As shown below, this scene features a fairly high amount of geometric clutter. The scene includes stacks of wood palettes and crates, steel I-beams, piles of corrugated steel panels, steel pipes, shipping containers, concrete barriers and other "cultural clutter" objects that might be found at a site like this. The scene was created with roughly a 0.10 [m] GSD in mind.
It includes full spectral coverage in the visible, NIR, and SWIR. This will be extended to the MWIR and LWIR in the future.
Placement of geometry and material attribution was done using Blender together with some DIRSIG I/O python scripts. The material database was manipulated using the "mat_edit" tool. The material map over the terrain was originally drawn as a vector layer using Inkscape and then cleaned and converted to its final PGM version using Gimp.
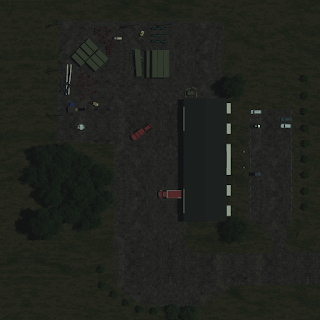
In addition to adding LWIR coverage, we would like to improve the terrain for future releases. Currently the ground is simply a large flat plate. This would ideally be replaced with some real digital elevation map (DEM) data. The terrain material map and all the textures could also use improvement.
As shown below, this scene features a fairly high amount of geometric clutter. The scene includes stacks of wood palettes and crates, steel I-beams, piles of corrugated steel panels, steel pipes, shipping containers, concrete barriers and other "cultural clutter" objects that might be found at a site like this. The scene was created with roughly a 0.10 [m] GSD in mind.
It includes full spectral coverage in the visible, NIR, and SWIR. This will be extended to the MWIR and LWIR in the future.


Placement of geometry and material attribution was done using Blender together with some DIRSIG I/O python scripts. The material database was manipulated using the "mat_edit" tool. The material map over the terrain was originally drawn as a vector layer using Inkscape and then cleaned and converted to its final PGM version using Gimp.
In addition to adding LWIR coverage, we would like to improve the terrain for future releases. Currently the ground is simply a large flat plate. This would ideally be replaced with some real digital elevation map (DEM) data. The terrain material map and all the textures could also use improvement.
The scene took about two full man-days of work to construct. The Blender scripts we have been written will be made available to the user community at some point. We just need to create some minimal documentation for how install the scripts and then how to use them.
Comments