Here is a look at the input files that go in to a DIRSIG simulation.
Each icon in the dirsig_edit tool corresponds to an XML file:
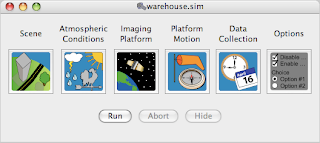 Behind the scenes, these files are given the following extensions:
So what goes in to the ".sim" manifest file? It's simply a list of the files assigned to each component. A typical sim file looks as follows:
<simulation>
<scene externalfile="../../warehouse.scene" />
<atmosphericconditions externalfile="./warehouse.atm" />
<platform externalfile="./warehouse.platform" />
<platformmotion externalfile="./warehouse.ppd" />
<tasklist externalfile="./warehouse.tasks" />
</simulation>
See? Nothing more than a list of files.
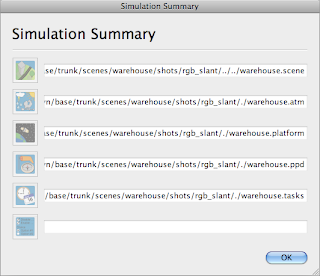
You can also see the relationship between files and components from within dirsig_edit. Just select Tools -> View summary.
 When doing trade studies, understanding the relationship between files and components can make your life easier. You can run DIRSIG on a sim file from the command-line using:
prompt% dirsig -xml foo.sim
You can also skip the sim file and specify the individual component files directly:
prompt% dirsig -xml foo.options foo.scene foo.atm foo.platform foo.ppd foo.tasks
If you don't have an options file, just use a pair of empty quotes:
prompt% dirsig -xml "" foo.scene foo.atm foo.platform foo.ppd foo.tasks
For running a trade study with ten different atmospheric conditions, you can write a shell script which uses this component syntax, passing in a different ".atm" file each time.
Each icon in the dirsig_edit tool corresponds to an XML file:
 Behind the scenes, these files are given the following extensions:
- .scene
- .atm
- .platform
- .ppd
- .tasks
- .options
So what goes in to the ".sim" manifest file? It's simply a list of the files assigned to each component. A typical sim file looks as follows:
<simulation>
<scene externalfile="../../warehouse.scene" />
<atmosphericconditions externalfile="./warehouse.atm" />
<platform externalfile="./warehouse.platform" />
<platformmotion externalfile="./warehouse.ppd" />
<tasklist externalfile="./warehouse.tasks" />
</simulation>
See? Nothing more than a list of files.
You can also see the relationship between files and components from within dirsig_edit. Just select Tools -> View summary.
 When doing trade studies, understanding the relationship between files and components can make your life easier. You can run DIRSIG on a sim file from the command-line using:
prompt% dirsig -xml foo.sim
You can also skip the sim file and specify the individual component files directly:
prompt% dirsig -xml foo.options foo.scene foo.atm foo.platform foo.ppd foo.tasks
If you don't have an options file, just use a pair of empty quotes:
prompt% dirsig -xml "" foo.scene foo.atm foo.platform foo.ppd foo.tasks
For running a trade study with ten different atmospheric conditions, you can write a shell script which uses this component syntax, passing in a different ".atm" file each time.
Comments